
Pivot
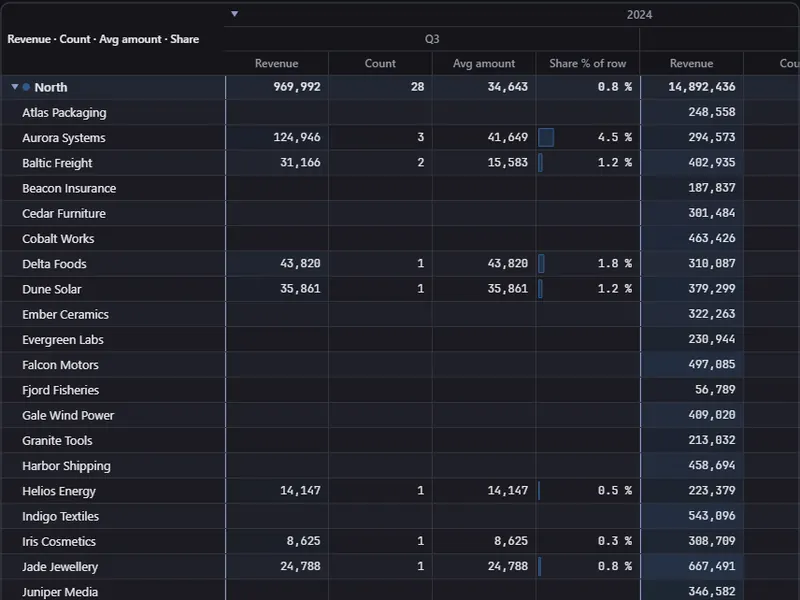
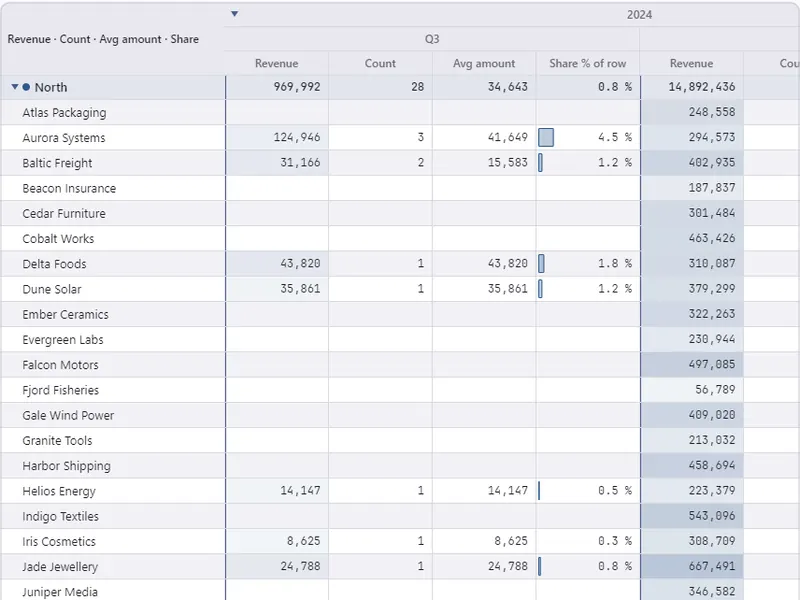
ArionUI.Pivot · free during the preview, also commerciallyThe same records summarised over two axes: groups down the side, groups across the top, measures in the cells. Both axes collapse, the user can reshape the layout in a field list, and a double-click shows the records behind a value.
Install
dotnet add package ArionUI.Pivot --prereleaseThe package brings ArionUI.Grouping along. There is no separate enabling call: constructing a PivotView is the call. A PivotSpec built by hand — axes and measures, as on Views — is enough for a fixed layout.
A layout the user can change
A PivotFieldModel is the catalogue of what may go where: fields that can become an axis, measures that can become values. You assign some of them to rows, columns and values; BuildSpec turns the assignment into the spec the view draws.
var fields = new PivotFieldModel(
    [
        new PivotField("Region", new GroupSpec(o => ((Sale)o).Region)),
        new PivotField("Product", new GroupSpec(o => ((Sale)o).Product)),
        new PivotField("Year", new GroupSpec(o => ((Sale)o).Date.Year)),
        new PivotField("Quarter", new GroupSpec(o => (((Sale)o).Date.Month + 2) / 3, k => $"Q{k}")),
    ],
    [
        new PivotMeasureField("Revenue", new AggregateSpec("Revenue", AggregateFn.Sum,
                                                           o => ((Sale)o).Amount, v => v.ToString("N0"))),
        new PivotMeasureField("Orders", new AggregateSpec("Orders", AggregateFn.Count)),
    ]);

fields.RowFields.Add("Region");
fields.ColumnFields.Add("Year");
fields.ColumnFields.Add("Quarter");
fields.AddValue("Revenue");
fields.AddValue("Revenue", PivotValueDisplay.PercentOfRow, PivotValueVisual.Bar);

var source = new SortFilterSource(new ListItemsSource<Sale>(sales));
var pivot = new PivotView(source, fields.BuildSpec(grandTotalLabel: "Total"))
{
    Fields = fields,   // makes the layout editable in the field list
};
grid.MainView = pivot;
The pivot machinery takes object and casts, because a pivot's shape is chosen at run time. GroupSpec says what a level groups by and how its key reads; AggregateSpec says what is summarised — Count, Sum, Avg, Min, Max or a custom function — and how the result formats.
Showing values
PivotValueDisplayValue,PercentOfGrandTotal,PercentOfRow,PercentOfColumn,Rank,DiffPreviousColumn— the same measure shown as its value, a share, a rank or a change.PivotValueVisualNone,Heatmap(a colour per cell) orBar(a bar in the cell).
Field list and drill-down
PivotPanes.ShowFieldList(grid, pivot, new LogPoint(24, 24));   // the drawn field list pane

pivot.CornerClicked += () => PivotPanes.ShowFieldList(grid, pivot, new LogPoint(24, 24));

pivot.DrillDownRequested += (row, columnPath, valueIndex, records) =>
    Log($"{records.Count} sales behind this cell");
The field list is a drawn pane in which the user drags fields between rows, columns and values, reorders and removes them and picks how a value is shown; every change applies at once. To apply changes you made to the model in code, call ApplyFields(); to replace the spec outright, Reconfigure(spec). CornerClicked fires on the top-left corner cell, the natural place to open the field list. DrillDownRequested passes the pivot row, the column path, the index of the value and the source records behind the double-clicked cell.
Filters and live data
The pivot reads from a SortFilterSource. Pass the one a table already uses, and a filter set in the table carries into the pivot — the sources chain rather than duplicate. SetQuickFilter filters the pivot on its own. Over an observable source the pivot can re-aggregate by itself; otherwise call Refresh().
pivot.FollowsSource = true;                          // re-aggregate when the source changes ...
pivot.FollowInterval = TimeSpan.FromSeconds(1);      // ... at most once a second
Texts of the field list are German by default; PivotUiText.English() switches them. The grand-total label is a parameter of BuildSpec and of PivotSpec, with the default "Gesamt".